In the deeply personal world of hospice care, an agency’s digital presence is often the first, and most important, introduction a family has to the organization. A hospice agency must place significant focus on managing its online reputation.
The Intimacy of In-Home Care
For families considering hospice, the decision isn’t just about finding a medical provider; it’s about inviting a team into their home during a profoundly intimate and vulnerable time. This means that trust is paramount, and it’s built on a foundation of empathy and personal connection. Your agency’s online reputation is a powerful tool in this process; your digital presence can give patients and their families greater insight into the quality of its services before the patient or family even have any contact with your agency.
With almost two-thirds of adults using online research for medical information, families are likely to see online reviews about your agency even before they see your agency’s website. These real-time opinions can shape their perception of the care your agency can provide before your agency is able to describe its care and tell its story.
You Can’t Control the Reviews, But You Can Control the Response
While you can’t control what someone writes about your organization, you have full control over how you respond. An organization that ignores online reviews or social media comments is seen as unresponsive, a major red flag in a field where responsiveness is everything. By contrast, a hospice that responds with gratitude to a positive review and with empathy to a negative one shows that it is committed to its community and takes feedback seriously. This not only mitigates potential harm from negative comments but also demonstrates a genuine commitment to patient care.
Building Your Internal Reputation Management System
To effectively manage your online presence, it’s crucial to have a playbook. This means implementing an internal system to stay on top of reviews and social media comments. While it may seem like a daunting task, a dedicated system ensures a calm and consistent response.
This system should involve:
Assigning a leader: A communications or marketing leader to oversee the digital presence.
Tapping clinical and HR support: A clinical or operations leader can address care-related concerns, while an HR professional can handle employee-specific feedback.
Identifying key platforms: Know where your organization is receiving the most feedback.
Creating a response playbook: Have pre-written guidelines to ensure you address both positive and negative comments with the right tone and message.
By proactively managing your online reputation, you are not just controlling a narrative; you are reinforcing your core values, fostering trust, and ultimately, ensuring families feel confident and secure in their decision to choose you.
This blog discusses an organized approach for monitoring your agency’s online presence and digital feedback on your agency. Monitoring your Hospice’s Presence Online
Goals have come to dominate our modern workplace. Goals are a way of breaking down business plans into smaller more manageable pieces. This enables an organization to accomplish some of the targets and plans that were specified during their planning cycle.
Organizations set strategic goals, teams set team goals, and employees set individual goals. Team goals and employee goals should be aligned with and supporting the organizational strategic goals.
A common practice is that goals are set early in the year and then, at the end of the year, achievement against those goals is measured. For example, an employee will usually meet with his or her manager early in the year to define goals for the year. Then, at the end of the year the employee is measured against the stated goals that were set at the beginning of the year. Further, employee bonuses are frequently tied to the successful completion of their defined goals. The widely accepted understanding is that goals should be SMART: specific, measurable, achievable, realistic, and time bound.
Is this the best approach?
SMART goals are widely used to implement strategies and monitor performance, but research suggests that some elements of SMART goals may hinder an organization’s broader objectives.
The first consideration is the overall timeline of the process. SMART goals are set once and then individuals and teams work throughout the year to achieve these goals. However, this approach overlooks the value of ongoing discussions throughout the year. In today’s fast-changing environment, failing to regularly revisit and adjust goals can be a significant risk for organizations.
Another consideration is the achievable aspect of SMART goals and the fact that employee end of year compensation is tied to achieving goals. Employees often set overly conservative goals to ensure success, stifling ambition and overall organizational success.
Finally, this process does not encourage collaboration, which is a key element to achieving organizational success. When individuals and teams set their own goals that are not shared with others in the organization, there is a risk of misaligned goals across different individuals and teams within the organization.
FAST goals can help to overcome some of these downsides of SMART goals.
What are FAST goals?
Frequently Discussed: Short term goals that allow for faster evaluation and achievement cycles, with multiple review cycles throughout the year. Progress toward the goal and resources allocated toward the goal are discussed on a regular basis. The feedback loop enables fast modifications, as required.
Ambitious: The goals are possible to achieve but stretch you a little – just past your point of comfort. Goals that are challenging yet achievable with effort — commonly referred to as stretch goals —motivate us to strive toward achieving them.
Specific: The goals have concrete milestones and metrics. This way you can measure how much progress you have made toward achieving the goal.
Transparent: The goals should be available for view across the organization. Employees should feel comfortable sharing their goals with team members and those outside their team. This encourages accountability and drives the organization to meet its overall strategic goals. This also helps to overcome the risk of misaligned goals. Finally, if an element of bonus or profit sharing is tied to the organization meeting its overall strategic goal, transparency allows and encourages individuals and teams to provide support across the organization, also increasing the likelihood that the organization will meet its strategic goals.
What are the benefits of FAST goals?
FAST goals benefit employees by fostering a sense of purpose and connection to the organization’s larger mission, boosting morale and engagement. The emphasis on regular feedback and collaboration helps employees feel supported and valued, while ambitious yet achievable goals encourage growth and innovation without fear of failure. This approach creates a positive work environment where individuals are motivated to excel and contribute meaningfully to the team’s success. All of this contributes to the success of the organization and helps the organization achieve its organizational goals.
In today’s rapidly evolving workplace, FAST goals offer a modern approach to goal-setting that emphasizes agility, alignment, and accountability. By focusing on frequent discussions, ambitious yet achievable objectives, and transparent tracking, FAST goals drive collaboration and innovation across teams. Unlike traditional methods, this approach encourages employees to stay adaptable and aligned with organizational priorities, even in dynamic environments. As businesses continue to navigate change, adopting FAST goals can be a powerful strategy to foster growth, improve performance, and achieve long-term success.
The podcasts cover a wide range of interesting and timely topics such as leadership, workplace violence, revenue capture, AI, use of technology, and how to best work with healthcare consultants.
Plan to listen while you are driving to patient visits!
Check back often to see what new podcasts have been released.
Patient length of stay is monitored to detect instances of inappropriate use of the hospice benefit or other deficiencies in the services delivered by the hospice provider. Length of stay is monitored for both very short length of stay as well as for length of stay that is longer than the norm.
What may unusual length of stay tell a hospice provider?
When patients are discharged alive with a short length of stay it may signal that the patient did not understand the hospice benefit when the patient was admitted to hospice. Or, patients may discharge live from hospice after just a few days because they were not satisfied with the services delivered by the hospice provider. Patients with length of stay longer than 180 days could be indicative of a patient who is no longer hospice eligible. Patients who are no longer eligible for service should be discharged from hospice and any payments that were received from Medicare while the patient was no longer eligible for services should be returned to Medicare. Failure to discharge the patient or failure to return the funds are examples of fraud and abuse.
How is length of stay calculated?
Length of stay is calculated based on the number of days that a patient receives hospice care. Specifically, for a patient who is discharged from hospice (whether or not the patient is discharged alive), the patient length of stay is calculated as follows:
Patient length of stay = [patient discharge date]-[patient admission date]+1
Which patients are included in length of stay calculation?
The length of stay calculation assumes that only discharged patients are considered in the calculation – since the formula expressly refers to the patient discharge date. When only discharged patients are considered (whether live discharges or discharges due to death), the hospice provider only has a backward-looking view on performance relating to length of stay. For example, if a hospice provider has been providing service to a patient for 12 months and the patient is still on service, the patient will not be included in the traditional average length of stay metric – since the patient has not yet been discharged. On the other hand, once the patient is discharged the patient’s length of stay will be at least 365 days since the patient – while still currently active – has already been on service for 365 days. If active patients are considered in a length of stay calculation, it gives a hospice provider a metric that can be used to highlight patients whose clinical charts and documentation of care may benefit from additional review.
What length of stay metrics should be calculated?
In addition to computing average and median length of stay based on discharged patients only, average and median length of stay can be computed for active patients. Patient length of stay for an active patient is calculated as follows:
Active patient length of stay = [end of evaluation period date]-[patient admission date]+1
For example, suppose the current date March 15, 2023 and a hospice wishes to calculate the active patient length of stay as of the end of 4Q 2022 for a patient who was admitted on December 1, 2022. The calculation is as follows:
End of evaluation period date: 12/31/22
Patient admission date: 12/1/22
Active patient length of stay = (12/31/22) – (12/1/22) + 1 = 31 days
The active patient length of stay as of the end of 4Q 2022 is 31 days.
If the hospice wishes to calculate the active patient length of stay as of current date, the calculation is as follows:
End of evaluation period date: 3/15/23
Patient admission date: 12/1/22
Active patient length of stay = (3/15/23) – (12/1/22) + 1 = 105 days
Average and median length of stay would be computed as usual. If any concerning value — such as long length of stay – is identified based upon the active patient length of stay, a hospice provider can immediately investigate and determine if any remediation action is required, rather than waiting until patients are discharged. Delay can lead to additional fines or further action from Medicare.
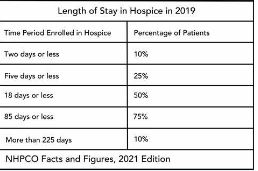
Patients are eligible for hospice if they have a terminal diagnosis and a prognosis of six or fewer months to live if their disease runs its natural course. A patient who lives longer than six months can still get hospice care if the medical director or other hospice physician recertifies that the patient is still terminally ill.
What is hospice patient length of stay?
Hospice length of stay is an important metric that is monitored by both CMS and by hospice providers. Hospice length of stay measures the count of days that a patient receives hospice services, from the day that the patient is admitted into hospice until the day the patient is discharged (either alive or deceased). In 2018, 25% of Medicare beneficiaries received hospice care for seven days or less and 54% of Medicare beneficiaries received hospice care for 30 days or less.
Why should a hospice monitor patient length of stay?
Monitoring patient length of stay can aid in detecting cases of possible fraud or abuse – instances where ineligible patients continue to receive the hospice benefit. This metric also helps monitor whether the hospice benefit is being adequately utilized. Although patients are eligible for hospice when they have six months or less to live, most patients receive less than 30 days of hospice care.
Agency patient length of stay is also trended over time and is also compared against the value for patients in the same region, state, or nationwide. The metric may also be analyzed for patients in subpopulations – for example patients with the same disease, race, or ethnicity.
How is patient length of stay calculated?
Patient length of stay is calculated using all patients discharged by the hospice provider during the reporting period. For example, if the hospice would like to compute the length of stay for patients during the 4Q 2022, all patients who were discharged during 1Q 2023 would be included in the calculation. For each patient, the number of days from the date of patient admission until the date of patient discharge is counted; this represents the patient length of stay.
Patient length of stay = [patient discharge date]-[patient admission date]+1
What are common measures of length of stay?
Two common patient hospice length of stay measures are Average Length of Stay (ALOS) and Median Length of Stay (MLOS).
Average length of stay
Average length of stay is the arithmetic mean of the data collected. Specifically, if d is patient length of stay and N is the total number of patients then average length of stay (ALOS) is calculated as follows:
ALOS = ( d1 + d2 + d3 + …. + dn ) /N
Where di = patient length of stay for patient i
Median length of stay
Median length of stay is the middle number in the sequence of numbers. Specifically, compute the length of stay for all N patients. Then, order these N numbers in ascending order. The middle number is the median. If the number of patients is even then there is no middle number. Instead, the median is calculated by taking the average of the two numbers in the middle.
Comparing average and median length of stay
The average is sensitive to outliers in the data. That is, if there are a few patients with a very high length of stay while all other patients have a significantly lower length of stay, the average will be biased by these outliers and will give a misleading assessment of overall patient length of stay. Below, we give an example to provide greater intuition into the impact of outliers on average length of stay and the difference between mean and median length of stay.
Suppose a hospice agency discharged 35 patients during 4Q 2022. The patients’ lengths of stay are as follows:
We compute the average length of stay by summing each of the 35 patient’s length of stay (in the “Length of Stay” column) and dividing that total by 35 (the total count of patients).
Average length of stay (ALOS) = 38.5
We compute the median length of stay by sorting the patient’s length of stay in ascending order and identifying the central number. Since there is an odd number of patients, there will be a single central value. In this case, the central value is 20.
Median length of stay (MLOS) = 20
Average length of stay is almost double the median length of stay. What is leading to these significant differences between ALOS and MLOS? Observe the outliers in the data. There are two patients with length of stay that exceeds 200 days. There are two additional patients with length of stay exceeding 100 days. Since ALOS is sensitive to outliers, ALOS is being pulled to a higher value due to the presence of these outliers.
To provide additional insight, we have plotted a histogram of the length of stay values. A histogram shows the count of observations in the data that fall in each of the specified ranges.
The table on the left shows the count (frequency) of observations of patient length of stay in the data for each of the ranges: 0-10 days, 10-20 days, 20-30 days, 30-40 days, and greater than 40 days. There are 11 patients with length of stay between 0-10 days, 7 patients with length of stay between 10-20 days, 6 patients with length of stay between 20-30 days, 6 patients with length of stay between 30-40 days, and 4 patients with length of stay that exceeds 40 days.
Think about this histogram and now consider the MLOS and ALOS. Median length of stay is 20 days – it falls well in the middle of the data. Average length of stay, however, equals 38.5. It falls, essentially, in the final bar of this histogram and well beyond where the majority of the data lies. The provides a visual demonstration of the impact of outliers on ALOS.
Providers should monitor both ALOS and MLOS. Significant differences between these numbers would indicate the presence of outliers and should be investigated.
Print ‘n take hospice keys
Understanding the difference between the average (mean) and the median
Like all other business decisions, a hospice marketing plan must be data driven. More progressive hospice agencies have increasingly begun to understand the value of many types of data in supporting business decisions. This includes internal data such as patient EMR data, financial data including general ledger revenue and expense data (at various levels of aggregation), and quality data. It also includes external data such as publicly available claims data, cost report data, and referral data.
This article published in June 2021 discusses how hospice agencies are using data analysis as a tool to gain an edge over competitors when engaging with potential referral sources. The discussion focuses on use of data analysis to identify which physicians represent referral sources that are more likely to produce (higher quality) referrals. This 2016 NHPCO article discusses the use of hospice metrics as a marketing tool. For example, a hospice agency can share statistics on reduction in hospital admissions for its patients in hospice compared to hospital admissions prior to hospice admission. Other metrics on cost of care or patient satisfaction are of interest, depending upon the referral source.
What data is valuable for designing a marketing strategy?
A hospice should gather data so that it can develop a complete picture of the customers that it serves. It should analyze its patients – including referral sources and patient attributes such as patient diagnosis, length of stay, and patient demographics. Referral sources can be analyzed at different levels of aggregations such as geographic location, facility type, physician type, and physician name. Analysis of hospice patients should be compared to analysis of data for the entire market (in the relevant geographic region). This can help a hospice agency identify where it may have strengths or weaknesses and contribute to its marketing strategy.
Analyze the data: gain input from multiple sources
When analyzing the output of the data analysis, the hospice agency should solicit input from multiple sources in the organization. Combining different perspectives on the data such as input from the executive, marketing, and clinical teams will provide a more holistic view and a more accurate assessment of the current marketing performance and how the go-forward marketing strategy should be designed.
How can the data be analyzed?
The simplest method for analyzing the data is to use Microsoft Excel. Excel is widely used in most organizations, so gaining access to this software should not be difficult. With relatively simple commands, one can analyze data and create charts to visualize the results of data analysis. Another benefit of using Excel for data analysis is that a lot of educational material is available on the Web to answer any questions that you may have about using Excel – in case there are data analysis functions that you want to learn more about.
What other information may be relevant to developing a strategy?
Patient data and claim data are historical data that are important inputs to a developing a marketing strategy. A hospice agency should also analyze forward-looking data as well as more general information such as:
What are hospice market trends in the geographic region?
How competitive is the marketplace and are there expectations for change in competition in the near term?
How well is the role of hospice understood by communities in the geographic region?
Is the use of hospice accepted by communities in the geographic region?
Is hospice understood by the medical community in the geographic region?
What are the demographics of your geographic region and are they expected to change in the near term?
Combining analysis of historical and forward-looking data and soliciting input from team members with different perspectives such as operational, clinical, and marketing will help a hospice agency develop an effective marketing plan.
Used to monitor number of Google Analytics server requests when using Google Tag Manager
1 minute
__utmv
Contains custom information set by the web developer via the _setCustomVar method in Google Analytics. This cookie is updated every time new data is sent to the Google Analytics server.
2 years after last activity
__utmx
Used to determine whether a user is included in an A / B or Multivariate test.
18 months
_ga
ID used to identify users
2 years
_gali
Used by Google Analytics to determine which links on a page are being clicked
30 seconds
_ga_
ID used to identify users
2 years
_gid
ID used to identify users for 24 hours after last activity
24 hours
__utma
ID used to identify users and sessions
2 years after last activity
__utmt
Used to monitor number of Google Analytics server requests
10 minutes
__utmb
Used to distinguish new sessions and visits. This cookie is set when the GA.js javascript library is loaded and there is no existing __utmb cookie. The cookie is updated every time data is sent to the Google Analytics server.
30 minutes after last activity
__utmc
Used only with old Urchin versions of Google Analytics and not with GA.js. Was used to distinguish between new sessions and visits at the end of a session.
End of session (browser)
__utmz
Contains information about the traffic source or campaign that directed user to the website. The cookie is set when the GA.js javascript is loaded and updated when data is sent to the Google Anaytics server
6 months after last activity
_gac_
Contains information related to marketing campaigns of the user. These are shared with Google AdWords / Google Ads when the Google Ads and Google Analytics accounts are linked together.