What is Hospice Care Index (HCI)?
HCI is a single comprehensive metric reflecting ten indicators of care delivered during a hospice stay — from admission to discharge. This metric, which is included in the patient Care Compare portal, is intended to provide patients, families, and caregivers with an added metric to support informed healthcare choices.
What are the data sources for this metric?
HCI is calculated from Medicare claims data. A hospice agency does not need to submit any additional data to CMS for the calculation of this metric. The HCI metric captures care processes throughout the duration of a patient’s hospice care – from admission through discharge. Only data for Medicare fee for service patients who have been discharged from hospice is included in the HCI metric. CMS calculates HCI using eight consecutive quarters of data. Hospice agencies with fewer than 20 discharges in the reporting period are not assigned an HCI value. By including eight quarters of data, CMS is expanding the set of hospice agencies for which an HCI value will be reported. CMS will update the HCI metrics once each year.
What does the HCI metric measure?
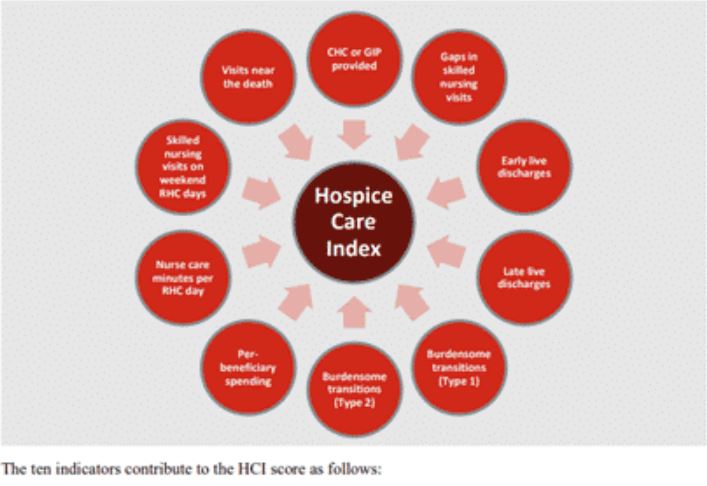
HCI is a single comprehensive metric comprised of the following ten individual indicators of care.
- CHC/GIP provided
- Gaps in skilled nursing visits
- Early live discharges
- Late live discharges
- Burdensome transitions (Type 1)
- Burdensome Transitions (Type 2)
- Per-beneficiary Medicare spending
- Nurse care minutes per routine home care days
- Skilled nursing minutes on weekends
- Visits near death
Each indicator measures a different aspect of hospice care. A set of the HCI indicators measure the agency’s provision of higher level of care as needed and more frequent visits closer to the time of death, as measured by indicators
- Gaps in skilled nursing visits
- Nurse care minutes per routine home care day
- Skilled nursing minutes on weekends
- Visits near death
A set of HCI indicators measure patterns of live discharges and transitions, as measured by indicators
- Discharges from hospice followed by hospitalization and hospice readmission
- Discharge from hospice followed by patient dying in the hospital
- Early live discharges
- Late live discharges
Finally, an HCI indicator is used to measure appropriateness of use of the hospice benefit
- Per beneficiary Medicare spending
Medicare’s overall objectives of the HCI metric are twofold: (i) to ensure that all hospice patients are receiving the care that they need and (ii) to identify indicators of fraud.
How is the HCI metric calculated?
The HCI metric simultaneously monitors all ten indicators of care. The ten indicators are then combined into a single value between zero and ten, where ten is the highest value. Each indicator equally affects the HCI value, reflecting how each aspect of care delivered, from admission to discharge, shares the same level of importance.
Specifically, the hospice agency is awarded one point for each of the ten indicator criteria the agency meets. A hospice receives a point for an indicator if its value exceeds a prescribed threshold. The threshold is determined as a function of the overall values for that indicator across all hospice agencies. The more indicators a hospice agency meets, the higher the agency’s HCI value. The sum of the points earned from meeting the criterion for each indicator yields the agency’s aggregated single HCI value.
When was HCI introduced and where can the metric be viewed?
The HCI metric was added to the HQRP and began public reporting in 2022.
The single aggregate HCI metric can be seen under the Quality of Patient Care section on the Care Compare website.
The details of the HCI metric – including the values for each of the ten individual HCI indicators – can be found in the Provider Data Catalog.
How can a hospice see details about its HCI value?
To support a hospice agency’s quality improvement efforts, CMS shares the details of an agency’s HCI indicator scores in the Hospice Agency Level QM Report in CASPER. An agency can benchmark its indicator values with state and national averages. It can also trend its performance in each indicator over time.
Where can you learn more?
- Background of HCI, its calculation, and its components: NHPCO – HCI Score
- Details on HCI indicators and calculating the HCI indicator values: CMS – HCI Score
- HQRP HVLDL metric: What is Hospice Visits in the Last Days of Life (HVLDL)?
Image from Home Care Pulse
